A Closer Look
Who is driving the changes in team and individual-sports participation?
By Nick Rigitano
Based on National Sporting Goods Association’s (NSGA) Total Participation Points (TPP) measure, team sports increased 1.6 percent in 2019 compared to the prior year, while individual sports increased 1.2 percent during the same timeframe. TPPs take into account both the number of people participating in each sport segment (reach) and the number of sports each person is participating in (depth).

Photo: © Can Stock Photo / amysuem
In the past, sports participation for different segments has largely been reported by the total number of people participating in a given segment (the number-of-participants measure), which doesn’t necessarily provide the whole story.

For example, in Figure 1, both Person A and Person B participated in soccer and baseball in Year 1. In Year 2, Person A continued to play both sports while Person B stopped participating in soccer. If using the number-of-participants measure, then Person B would have still been considered a Team Sports participant, since playing baseball continued in Year 2. However, if using the TPP measure, then participation declined because Person B was involved in one team sport instead of two.
What This Means For The Industry
What does this mean to a parks and recreation organization? The TPP measurement provides a clearer view of opportunities gained or lost. In Figure 1, there were four opportunities for program participation/facility use/etc. (two sports each with Person A and Person B) in Year 1. The number of opportunities decreased to three in Year 2 with Person B dropping soccer. Therefore, the total number of program participation/facility use/etc. opportunities decreased by 25 percent. By just looking at the number of participants, one would assume the opportunities remained the same over two years.

A deeper look into the changes and drivers behind the segment increases shows that eight of the 11 team sports tracked experienced increases (Figure 2) in 2019. Five of the eight sports experiencing increases (basketball, cheerleading, flag football, lacrosse, and softball) were driven by increases in female participation. The increases in baseball and soccer were driven by males, and volleyball experienced the highest percentage change in overall participation compared to the prior year (+5.3 percent), driven equally by males and females. Team sports experiencing decreases in participation, however, included tackle football and touch football, driven mostly by males, while the slight decrease in ice hockey was driven by females.
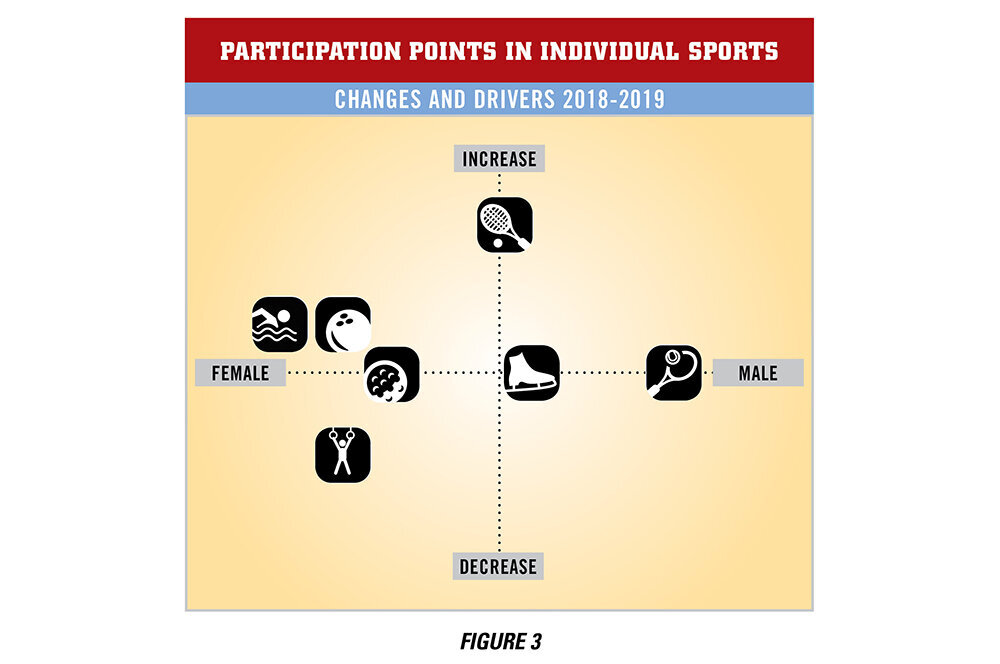
Figure 3 illustrates a similar story among individual sports. Five of the segment’s seven sports experienced increases in participation, three of which were driven by females (bowling, golf, and swimming). An increase in male participation in tennis (+2.5 percent) canceled out a decrease in female participation (-2.1 percent), resulting in a slight increase overall (+0.4 percent). Pickleball experienced the strongest gains (+3.5 percent) with increases in male and female participation. A decrease in female participation led to the decline for gymnastics, while males accounted for the slight drop in ice/figure skating.
Although it is important to note that one year does not make a trend, the 2019 increases were a welcome sight for both segments, which had each experienced a decline in 2018. Furthermore, the increases suggest that participation among team and individual segments was headed in the right direction prior to the outbreak of COVID-19 and offer a glimmer of hope that interest levels in sports might be able to tread water until America can fully reopen.
How To Use This Information
At this point, one might be asking, “Data are great, but how can I use those to draw insights related to my particular area?”
Here’s one example of how data can be used directionally to arrive at some insights. Let’s say there are 40,000 youths (ages 7 to 17) in a particular area outside a major metropolitan city, and you want to know approximately how many of them would be interested in participating in baseball. Starting with what is known at a national level based on the participation study, 5.6-million youths (7 to 17) in the U.S. participated in baseball during 2019. The total number of youths (7 to 17) based on the census estimates for 2019 was 45.6 million, meaning that 12.3 percent of youths participated in baseball during 2019. If this same percentage is applied locally to the area of interest, one would expect that approximately 4,900 youths would be participating in baseball during 2019.

Photo: © Can Stock Photo / imtmphoto
From there, one needs to adjust the estimates up or down based on additional information about the demographics making up the area of interest. Geographically, it is known from the report that the concentration of baseball participants for a particular region was above average in 2019, according to its index of 131 (100 is average), making people in this region 30 percent more likely to participate in baseball. Because people in this region are more likely to participate in baseball, the estimate for the area of interest could be adjusted upward to more than 5,000 potentially interested youths.
Even more important is using the data to identify trends during the last 3 to 5 years that can provide an outlook as to where participation is headed in the future. It is important to note, however, that this method is meant to be used directionally as a guide rather than to produce exact figures for a specific area. It is important to recognize that each local area has unique characteristics that make up its population. While it may not be perfect, using the data directionally and as a guidepost might be a helpful starting point.
For more information on the reports, visit www.nsga.org/research.
Nick Rigitano is the Director of Insights and Analysis for the National Sporting Goods Association.